Kubernetes Logs Observability with ClickStack — ClickHouse & HyperDX
First published on Medium ·
series: kubernetes-in-practice · 3/3▾ view

Managing an observability stack often feels like a constant battle between performance and cost.
The example case is we are looking for reliable, powerfull, and fast log query performance. The top of mind stack is Elasticsearch (ELK Stack). But as log volumes grow, the reality of managing it sets in: the compute costs for RAM and CPU become massive, and SSDs become a requirement just to keep the indexing from lagging under pressure.
Alternative way to cut the cost, many shift toward Grafana Loki. It feels like a major win at first because logs can be offloaded to shared external object storage like S3 or MinIO, significantly cutting storage overhead. Plus, it integrates perfectly with the Grafana ecosystem — Prometheus, Alloy, and OpenTelemetry.
However, a new wall eventually appears: query performance. When dealing with unstructured data or high-cardinality logs with many unique labels. Complex filtering that should take seconds often takes minutes, which is exactly what is not needed during a critical incident.
I was intrigued by ClickHouse’s claim of being a columnar database. In theory, this allows for lightning-fast filtering on high-cardinality logs while still keeping the storage benefits of Loki, as ClickHouse natively supports S3 backends. To make it even better, I found ClickStack, which bundles HyperDX — a UI that gives you that familiar Kibana.
Note: This is a setup guide based on my curiosity. I’m not presenting a final benchmark yet, but rather a walkthrough of how I got this stack running to see if it lives up to the hype.
Moving forward, let’s dive into the topology and thes setup steps. This design is built to ensure each component scales independently.
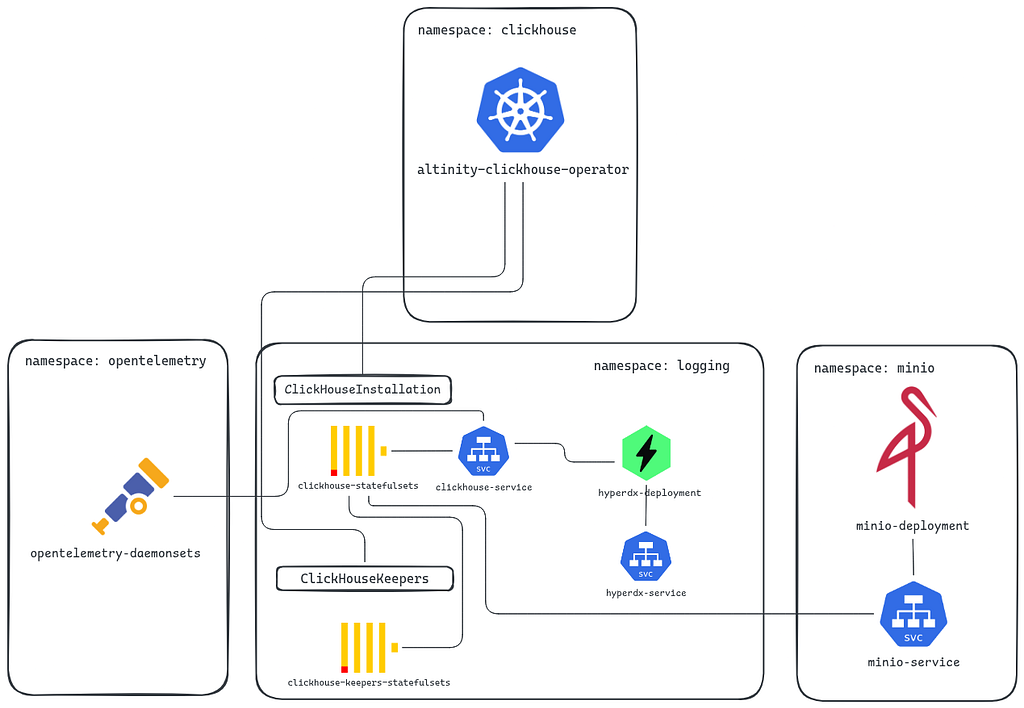
Prerequisite and Setup
- MinIO as external storage for ClickHouse. You can use other S3 object storage, like AWS S3 or GCS. In this post I won’t explain how to setup the MinIO, you can follow this guide to setup using Helm.
- Altinity ClickHouse operator, to deploy ClickHouse with High Availability setup.
- OpenTelemetry collector, to collect Kubernetes logs and forward to clickhouse.
- ClickStack, to deploy HyperDX UI with Helm chart.
Step 1: Deploy ClickHouse Operator
The first step is to install the Altinity ClickHouse Operator. This operator simplifies defining complex ClickHouse clusters — including shards, replicas, and keepers.
Optionally, prepare the Helm values for Altinity ClickHouse Operator. In this case, I will add specific namespace to watch the CRD, because I will deploy it on logging namespace.
configs:
  files:
    config.yaml:
      watch:
        namespaces:
          - logging

helm repo add altinity https://helm.altinity.com
helm install clickhouse-operator altinity/altinity-clickhouse-operator -n clickhouse --create-namespace -f altinity-values.yaml
Verify that the operator is running:
ubuntu@ubuntu-1:~$ kubectl get po -n clickhouse
NAME                                                              READY   STATUS    RESTARTS   AGE
clickhouse-operator-altinity-clickhouse-operator-f86457cb6bz7xj   2/2     Running   0          3m27s
Step 2: Provisioning ClickHouse Cluster with S3 Backend
Before continuing to deploy the ClickHouse, you need to prepare the bucket and access credential to the bucket, which access_key_id & secret_access_key.
Once the operator is ready and the bucket has been created, we can deploy the ClickHouse cluster. In this setup, I am using a High Availability configuration (2 shards, 2 replicas) integrated with MinIO object storage.
---
apiVersion: "clickhouse-keeper.altinity.com/v1"
kind: "ClickHouseKeeperInstallation"
metadata:
  name: ch-logging-keeper
  namespace: logging
spec:
  configuration:
    clusters:
      - name: "ch-cluster"
        layout:
          replicasCount: 3
---
apiVersion: "clickhouse.altinity.com/v1"
kind: "ClickHouseInstallation"
metadata:
  name: ch-logging
  namespace: logging
spec:
  configuration:
    zookeeper:
      nodes:
        - host: "keeper-ch-logging-keeper.logging.svc.cluster.local"
          port: 2181
    clusters:
      - name: "ch-cluster"
        layout:
          shardsCount: 2
          replicasCount: 2
    settings:
      storage_configuration/disks/logging/type: "s3"
      storage_configuration/disks/logging/endpoint: "http://minio.minio.svc.cluster.local:9000/logging/clickhouse/{installation}/{replica}/"
      storage_configuration/disks/logging/access_key_id: "YourS3AccessKeyID"
      storage_configuration/disks/logging/secret_access_key: "YourS3SecretAccessKey"
      storage_configuration/policies/s3_main/volumes/main/disk: "logging"
    users:
      admin_user/password:
        valueFrom:
          secretKeyRef:
            name: ch-logging-creds
            key: admin_password
      admin_user/networks/ip: "0.0.0.0/0"
      admin_user/profile: default
---
apiVersion: v1
kind: Secret
metadata:
  name: ch-logging-creds
  namespace: logging
type: Opaque
stringData:
  admin_password: "YourClickHouseAdminPassword"
After applying the configuration, verify the cluster status. Ensure all hosts show Completed, indicating successful installation of ClickHouse cluster.
ubuntu@ubuntu-1:~$ kubectl get chi -n logging
NAME          CLUSTERS   HOSTS   STATUS      HOSTS-COMPLETED   AGE
ch-logging    1          4       Completed   4                 2m7s
ubuntu@ubuntu-1:~$ kubectl get chk -n logging
NAME                CLUSTERS   HOSTS   STATUS      HOSTS-COMPLETED   AGE   SUSPEND
ch-logging-keeper   1          3       Completed                     2m9s
Step 3: Prepare Database Schema & OpenTelemetry
Create the otel_logs table using the s3_main policy. With the storage_policy = ‘s3_main’ setting, ClickHouse automatically writes data to MinIO.
Go inside to ClickHouse pod to execute the DDL to setup the table.
ubuntu@ubuntu-1:~$ kubectl exec -ti chi-ch-logging-ch-cluster-0-0-0 -n logging -- bash
root@chi-ch-logging-ch-cluster-0-0-0:/# clickhouse-client
chi-ch-logging-ch-cluster-0-0-0.chi-ch-logging-ch-cluster-0-0.logging.svc.cluster.local :) USE default;

USE default

Query id: f2181ccb-a3e3-42d6-83ae-ca75f6591633

Ok.

0 rows in set. Elapsed: 0.002 sec.

chi-ch-logging-ch-cluster-0-0-0.chi-ch-logging-ch-cluster-0-0.logging.svc.cluster.local :)

CREATE TABLE otel_logs ON CLUSTER 'ch-cluster'
(
   `Timestamp` DateTime64(9) CODEC(Delta(8), ZSTD(1)),
   `TimestampTime` DateTime DEFAULT toDateTime(Timestamp),
   `TraceId` String CODEC(ZSTD(1)),
   `SpanId` String CODEC(ZSTD(1)),
   `TraceFlags` UInt8,
   `SeverityText` LowCardinality(String) CODEC(ZSTD(1)),
   `SeverityNumber` UInt8,
   `ServiceName` LowCardinality(String) CODEC(ZSTD(1)),
   `Body` String CODEC(ZSTD(1)),
   `ResourceSchemaUrl` LowCardinality(String) CODEC(ZSTD(1)),
   `ResourceAttributes` Map(LowCardinality(String), String) CODEC(ZSTD(1)),
   `ScopeSchemaUrl` LowCardinality(String) CODEC(ZSTD(1)),
   `ScopeName` String CODEC(ZSTD(1)),
   `ScopeVersion` LowCardinality(String) CODEC(ZSTD(1)),
   `ScopeAttributes` Map(LowCardinality(String), String) CODEC(ZSTD(1)),
   `LogAttributes` Map(LowCardinality(String), String) CODEC(ZSTD(1)),
   INDEX idx_trace_id TraceId TYPE bloom_filter(0.001) GRANULARITY 1,
   INDEX idx_res_attr_key mapKeys(ResourceAttributes) TYPE bloom_filter(0.01) GRANULARITY 1,
   INDEX idx_res_attr_value mapValues(ResourceAttributes) TYPE bloom_filter(0.01) GRANULARITY 1,
   INDEX idx_scope_attr_key mapKeys(ScopeAttributes) TYPE bloom_filter(0.01) GRANULARITY 1,
   INDEX idx_scope_attr_value mapValues(ScopeAttributes) TYPE bloom_filter(0.01) GRANULARITY 1,
   INDEX idx_log_attr_key mapKeys(LogAttributes) TYPE bloom_filter(0.01) GRANULARITY 1,
   INDEX idx_log_attr_value mapValues(LogAttributes) TYPE bloom_filter(0.01) GRANULARITY 1,
   INDEX idx_body Body TYPE tokenbf_v1(32768, 3, 0) GRANULARITY 8
)
-- Use ReplicatedMergeTree for Open Source HA
ENGINE = ReplicatedMergeTree('/clickhouse/tables/{shard}/otel_logs', '{replica}')
PARTITION BY toDate(TimestampTime)
PRIMARY KEY (ServiceName, TimestampTime)
ORDER BY (ServiceName, TimestampTime, Timestamp)
-- This points it to your S3 bucket
SETTINGS storage_policy = 's3_main';
In this schema, I used the ReplicatedMergeTree engine. Since we are running a multi-node cluster with shards and replicas, this engine is essential for ensuring high availability. It works by communicating with ClickHouseKeeper to coordinate data replication across the cluster.
Whenever the OpenTelemetry Collector sends logs to one host through Kubernetes service, the engine automatically handles the background task of replicating that data to other replicas within the same shard. This ensures that if one node goes down, the data remains consistent and available on another node.
The OTel Collector needs a specific configuration to parse Kubernetes metadata and export data to ClickHouse.
mode: daemonset
presets:
  logsCollection:
    enabled: true
  kubernetesAttributes:
    enabled: true

config:
  exporters:
    clickhouse:
      endpoint: http://clickhouse-ch-logging.logging.svc.cluster.local:8123
      database: default
      username: admin_user
      password: "YourClickHouseAdminPassword"
      logs_table_name: otel_logs
      # We created the schema manually in Step 3
      create_schema: false
  service:
    pipelines:
      logs:
        receivers: [filelog]
        processors: [k8sattributes, batch]
        exporters: [clickhouse]
- k8sattributes: This processor enriches logs with pod names, namespaces, and labels.
- batch: Essential for performance; it groups logs together before sending them to ClickHouse.
helm repo add open-telemetry https://open-telemetry.github.io/opentelemetry-helm-charts
helm install -n opentelemetry --create-namespace otel-collector opentelemetry/opentelemetry-collector -f otel-collector-values.yaml
Check the logs to ensure the collector is watching the pod log files:
2026-01-04T15:20:29.550Z info fileconsumer/file.go:261 Started watching file {"path": "/var/log/pods/..."}
Step 4: Setting Up HyperDX with ClickStack
For the visualization, we use HyperDX via the ClickStack chart. HyperDX provides a modern, Kibana-like interface specifically optimized for ClickHouse.
Because we have already manually set up the ClickHouse cluster and OTel Collector, we must disable ClickStack’s internal versions of these components.
hyperdx:
  defaultConnections: |
    [
      {
        "name": "ClickHouse Logging",
        "host": "http://clickhouse-ch-logging.logging.svc.cluster.local:8123",
        "port": 8123,
        "username": "admin_user",
        "password": "YourClickHouseAdminPassword"
      }
    ]
# Disable internal components
otel: { enabled: false }
clickhouse: { enabled: false }
Next, install the HyperDX using Helm
helm repo add clickstack https://hyperdxio.github.io/helm-charts
helm install clickstack clickstack/clickstack -n logging -f clickstack-values.yaml
Once deployed, you can access the HyperDX setup page by creating a port-forward:
kubectl port-forward svc/clickstack-app 3000:3000 -n logging
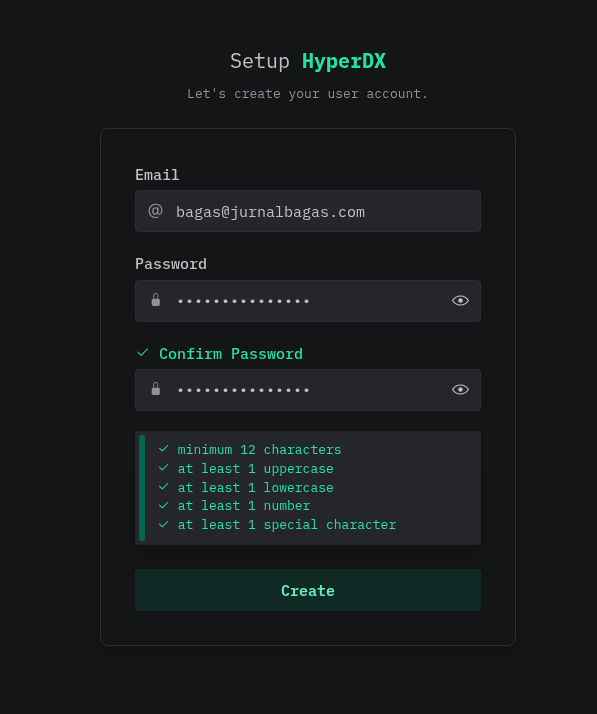
Navigate to http://localhost:3000 to create your admin account and explore the observability.
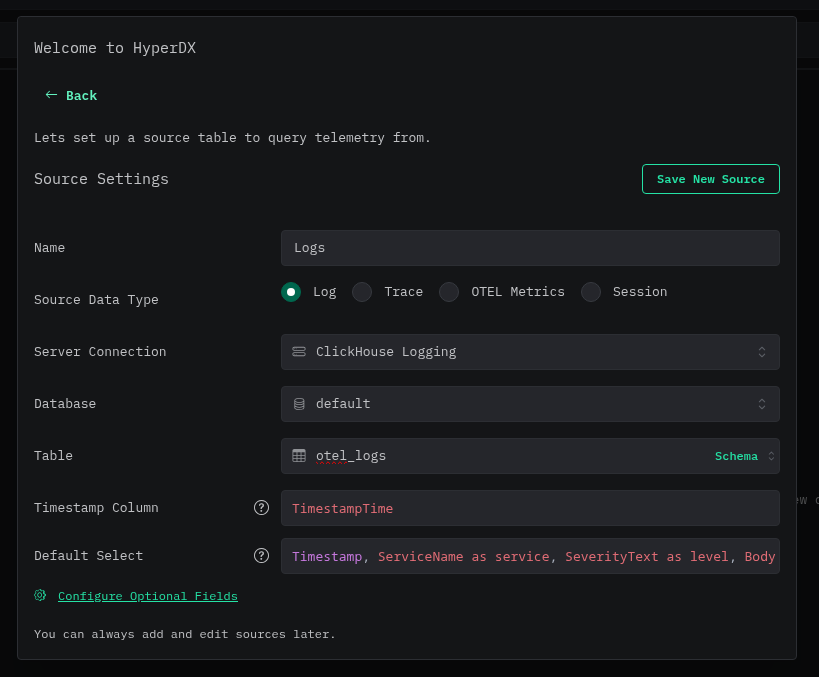
Now setup the source of Logging to start exploring the logs on HyperDX.
Putting it to the Test: Real-World Observability
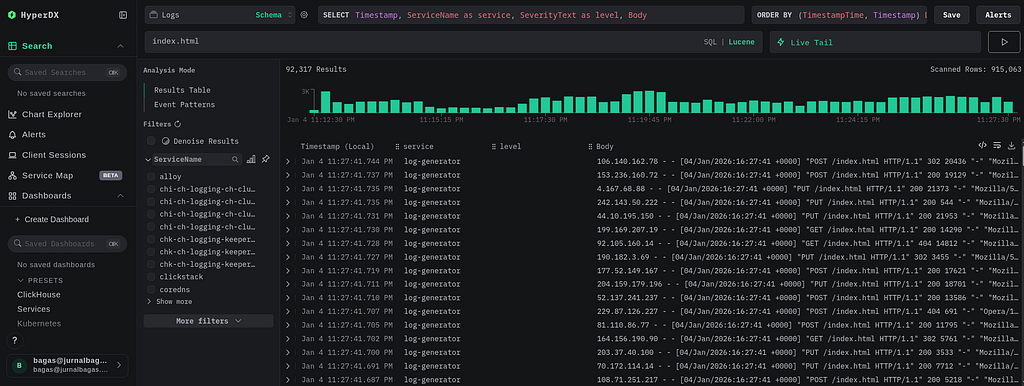
After getting everything deployed, the million-dollar question remains: Is it actually better? I spun up a log-generator to simulate some real traffic and started poking around the HyperDX dashboard. Honestly, the results were pretty satisfying. Here’s a breakdown of what the experience feels like:
1. Blaze Filtering
One of the coolest things is how ClickHouse handles high-cardinality filters. I tried searching for specific strings — like a particular URL or error message — directly in the Body column using Lucene syntax.
2. Dynamic Aggregation on Unstructured Logs
The outstanding of this columnar setup is that you don’t have to predict exactly how you’ll want to filter your data months in advance. In many systems, if you didn’t tag a field as a “label” during ingestion.
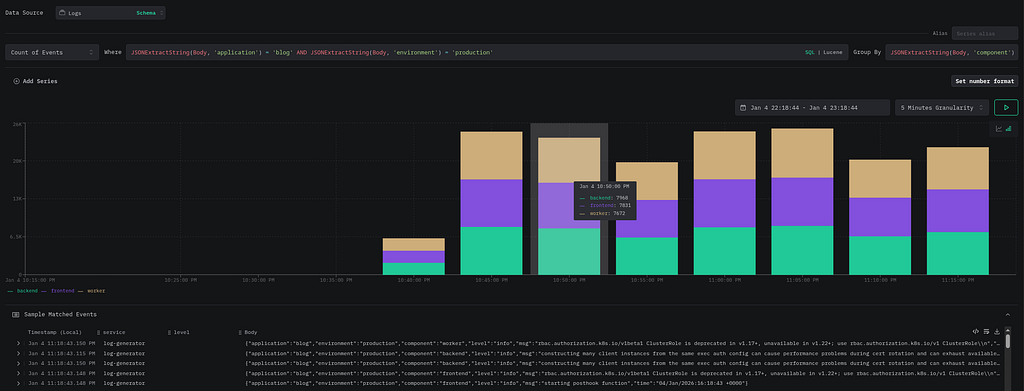
Instead of being limited by what was defined at ingestion time, I can use the JSONExtractString function to pull fields out of the raw JSON body whenever I need them.
For example, I wanted to see the log count distribution between my backend, worker, and frontend components. I just wrote a quick query, and HyperDX rendered a clean stacked bar chart immediately. The best part? I didn’t have to re-index anything or define new labels beforehand.
3. Granularity Shifts
While troubleshooting, being able to shift your perspective is key. I played around with the Time Granularity settings:
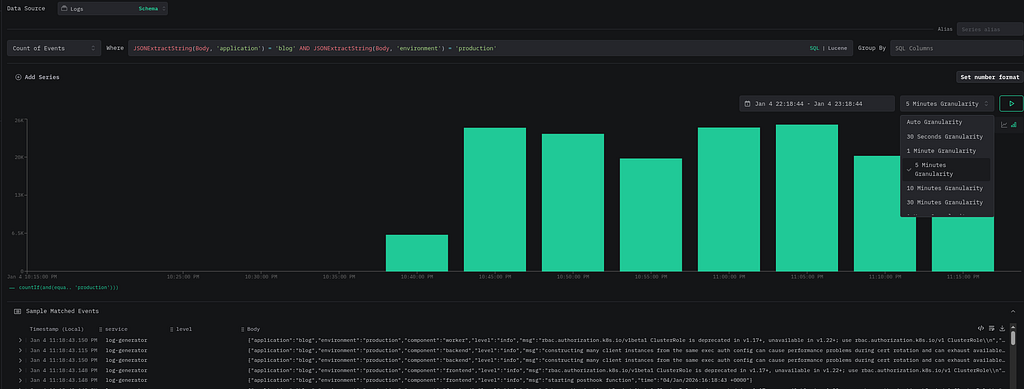
- Trend Analysis: Switch to 5 Minutes Granularity to see patterns over the last few hours.
- Incident Deep-Dive: Instant zoom-in to 30 Seconds Granularity to see exactly when an error spike started.
The switch is smooth because ClickHouse only scans the columns it needs, making the visualization feel very snappy even when the time range is wide.
4. Structured Visibility
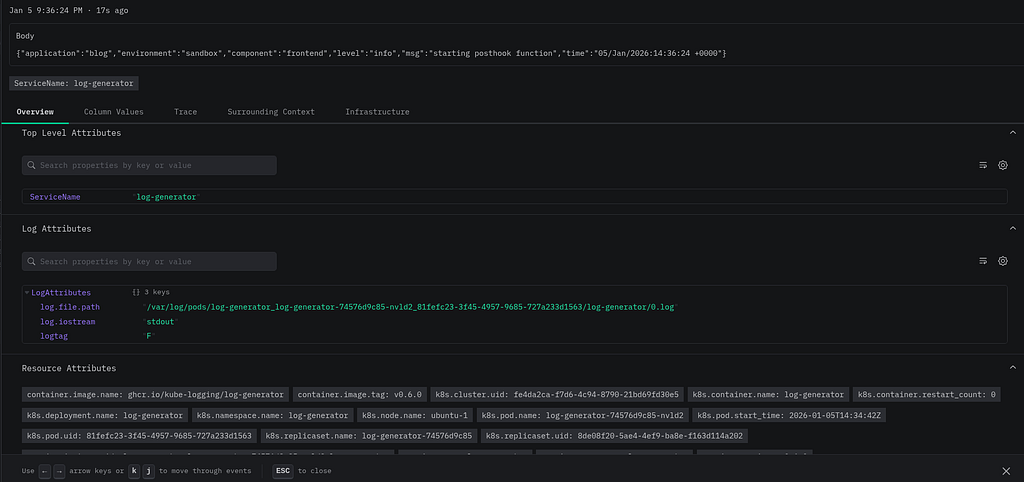
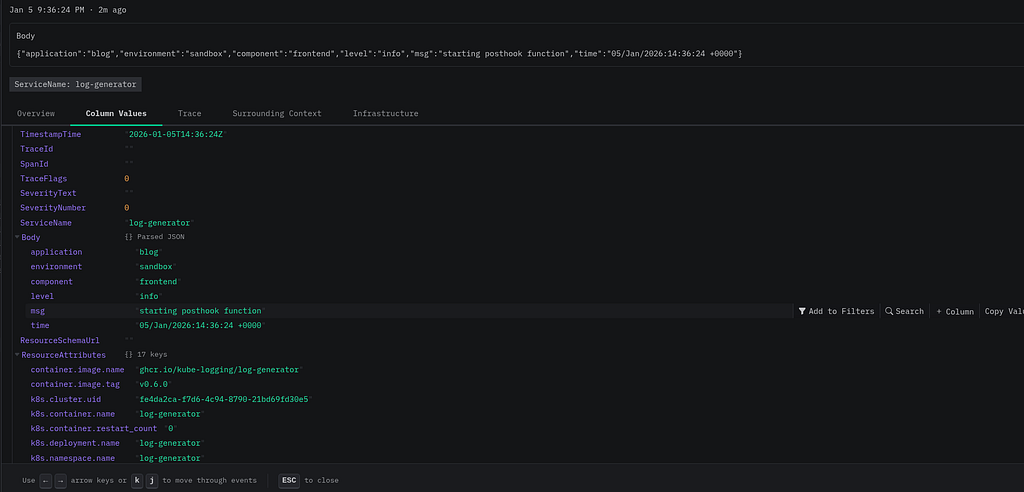
When you find an interesting log entry, you can just click into it. The Column Values tab in HyperDX automatically parses the JSON Body into structured key-value pairs. It makes the data much easier to digest, mapping out TraceId, ServiceName, and Kubernetes metadata in a clean, organized view.
Final Thoughts
This experiment was all about finding that “sweet spot”: keeping the storage efficiency of S3 while gaining the analytical speed of a columnar engine. Every tool has its place in the ecosystem. Elasticsearch remains the powerhouse for full-text search and maturity, while Loki is fantastic for its simplicity and minimal overhead in many standard scenarios.
However, once your use case shifts toward heavy filtering, instant aggregations, or dealing with high cardinality data without the massive of SSD-heavy clusters usages, this ClickHouse + OTel + HyperDX combo starts to look like a very serious alternative.
Thank you so much for taking the time to read through this exploration. I’ll be diving even deeper into this stack soon, so stay tuned for more updates.
What do you think? If you have any tips or want to share your own experience, drop a comment below. I’d love to get your thoughts!